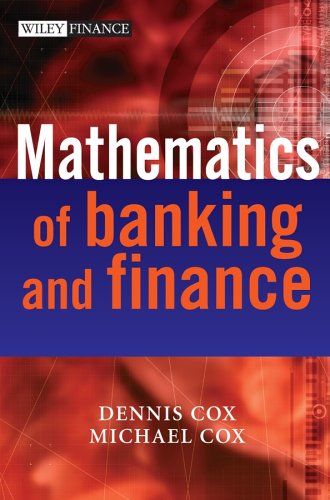
Dennis Cox, Michael Cox047001489X, 9780470014899
The Mathematics of Banking offers an intermediate guide to the various techniques used in the industry, and a consideration of how each one should be approached. Written in a practical style, it will enable readers to quickly appreciate the purpose of the techniques and, through illustrations, see how they can be applied in practice. Coverage is extensive and includes techniques such as VaR analysis, Monte Carlo simulation, extreme value theory, variance and many others. A practical review of mathematical techniques needed in banking which does not expect a high level of mathematical competence from the reader
Table of contents :
The Mathematics of Banking and Finance……Page 2
Contents……Page 8
Introduction……Page 16
1.1 Introduction……Page 18
1.3.1 An Example of Salary Against Age……Page 19
1.4 Why Draw a Scatter Plot?……Page 20
1.5 Matrix Plots……Page 21
1.5.1 An Example of Salary Against Age: Revisited……Page 22
2.2 Discrete Data……Page 24
2.3 Relative Frequencies……Page 25
2.4 Pie Charts……Page 29
3.1 Continuous Variables……Page 30
3.2 Cumulative Frequency Polygon……Page 31
3.3 Sturges’ Formula……Page 37
4.2 Basic Probability Concepts……Page 38
4.5 Independent Events……Page 39
4.7 Venn Diagrams……Page 40
4.8 The Addition Rule for Probabilities……Page 41
4.9 Conditional Probability……Page 42
4.10 The Multiplication Rule for Probabilities……Page 43
4.11 Bayes’ Theorem……Page 44
4.11.1 An Example of Bayes’ Theorem……Page 45
4.11.3 Bayes’ Theorem Applied to Insurance……Page 46
4.12.1 An Example of Prediction of Success……Page 47
4.12.2 An Example from an American Game Show: The Monty Hall Problem……Page 51
4.13 Conclusion……Page 52
5.2.1 Mean……Page 54
5.2.2 Median……Page 55
5.3 Upper and Lower Quartile……Page 56
5.4 MQMQM Plot……Page 57
5.6 Variance and Standard Deviation……Page 58
5.7 Measures for Continuous Data……Page 61
6.2 Planning Data Collection……Page 64
6.3 Methods for Survey Analysis……Page 65
6.3.3 Stratified Sampling……Page 66
6.4 How It Can Go Wrong……Page 67
6.6 Cautionary Notes……Page 68
7.2 Discrete Uniform Distribution……Page 70
7.2.2 Combination……Page 71
7.3 Binomial Distribution……Page 72
7.3.2 Pascal’s Triangle……Page 73
7.3.3 The use of the Binomial Distribution……Page 74
7.4 The Poisson Distribution……Page 75
7.4.1 An Example of the Poisson Distribution……Page 76
7.5 Uses of the Binomial and Poisson Distributions……Page 77
7.5.1 Is Suicide a Poisson Process?……Page 79
7.6 Continuous Uniform Distribution……Page 81
7.7 Exponential Distribution……Page 83
8.1 Introduction……Page 84
8.2 Normal Distribution……Page 85
8.2.2 A Second Example of Normal Probabilities……Page 86
8.4.1 An Example of the Central Limit Theorem……Page 87
8.5.1 An Example of Confidence Intervals for the Population Mean……Page 88
8.7 Normal Approximation to the Poisson Distribution……Page 89
8.7.1 An Example of Fitting a Normal Curve to the Poisson Distribution……Page 90
9.2 Estimation of the Mean……Page 92
9.2.1 An Example of Estimating a Confidence Interval for an Experimental Mean……Page 93
9.4 Hypothesis Testing……Page 94
9.4.1 An Example of Hypothesis Testing……Page 95
9.5.1 An Example of a Two-Sample t Test……Page 96
9.6.1 An Example of Type I and Type II Errors……Page 97
10.2.1 An Example of the Chi-Squared Test……Page 100
10.3.2 An Example Considering The Normal Distribution……Page 102
11.1 Introduction……Page 108
11.2 Contingency Tables……Page 109
11.3.1 An Example of a Four by Four Table……Page 111
12.2 t Test……Page 114
12.3 Sign Test……Page 115
12.4 The U Test……Page 116
12.4.1 An Example of the Use of the U Test……Page 118
13.2 Linear Regression……Page 120
13.3 Correlation Coefficient……Page 121
13.3.1 An Example of Examining Correlation……Page 122
13.4 Estimation of the Uncertainties……Page 126
13.6 ANOVA for Linear Regression……Page 127
13.8 Significance Test for the Slope……Page 129
13.8.1 An Example of Slope Analysis……Page 130
13.8.2 A Further Example of Correlation and Linear Regression……Page 132
14.2 Formal Background to the ANOVA Table……Page 138
14.3 Analysis of the ANOVA Table……Page 139
14.4.1 An Example of Extinguisher Discharge Times……Page 140
14.4.2 An Example of the Lifetime of Lamps……Page 142
15.2 Randomised Block Design……Page 146
15.2.1 An Example of Outsourcing……Page 147
15.3 Latin Squares……Page 148
15.4 Analysis of a Randomised Block Design……Page 149
15.5 Analysis of a Two-Way Classification……Page 152
15.5.1 An Example of Two-Way Analysis……Page 154
15.5.2 An Example of a Randomised Block……Page 157
15.5.3 An Example of the Use of the Latin Square……Page 160
16.2.1 An Example of an Optimum Investment Strategy……Page 166
16.2.2 An Example of the Optimal Allocation of Advertising……Page 171
17.2 Most Profitable Loans……Page 176
17.2.1 An Example of Finance Selection……Page 181
17.3.4 An Example to Demonstrate the Application of the General Rules for Linear Programming……Page 184
17.4 The Concerns with the Approach……Page 187
18.2 Transport Problem……Page 188
19.2 Principle of Optimality……Page 196
19.3.1 An Example of Forward and Backward Recursion……Page 197
19.3.2 A Practical Example of Recursion in Use……Page 199
19.3.3 A More Complex Example of Dynamic Programming……Page 201
19.3.4 The ‘Travelling Salesman’ Problem……Page 202
20.1 Introduction……Page 206
20.2 Project Analysis Guidelines……Page 207
20.3 Minimax Regret Rule……Page 209
21.2 The Economic Order Quantity Model……Page 212
21.2.1 An Example of the Use of the Economic Order Quantity Model……Page 213
21.3 Non-Zero Lead Time……Page 216
21.3.1 An Example of Poisson and Continuous Approximation……Page 217
22.2.1 An Example of the Use of Monte Carlo Simulation: Theory of the Inventory Problem……Page 220
22.3 Monte Carlo Simulation of the Inventory Problem……Page 222
22.4 Queuing Problem……Page 225
22.5 The Bank Cashier Problem……Page 226
22.6 Monte Carlo for the Monty Hall Problem……Page 229
22.7 Conclusion……Page 231
23.2 Replacement at a Fixed Age……Page 232
23.3 Replacement at Fixed Times……Page 234
24.2.1 An Example of Net Present Value……Page 236
24.3.1 An Example of the Internal Rate of Return……Page 237
24.5.1 Mathematical Background to the Payback Period……Page 239
24.5.2 Mathematical Background to Producing the Tables……Page 240
25.3 Uncertainty……Page 244
25.5.1 An Example of Expected Cash Flows……Page 245
25.6.1 An Example of Break-Even Analysis……Page 246
25.7.1 An Example of the Use of the Distribution Approach to the Evaluation of Net Present Value……Page 248
25.8 Measuring Risk……Page 249
25.8.1 An Example of Normal Approximation……Page 251
26.1 Introduction……Page 252
26.3 Seasonal Variations……Page 253
26.5 Mathematical Analysis……Page 257
26.7 Moving Average……Page 258
26.8 Trend and Seasonal Variations……Page 259
26.9 Moving Averages of Even Numbers of Observations……Page 261
26.10 Graphical Methods……Page 264
27.3 The Bathtub Curve……Page 266
27.4 The Continuous Case……Page 268
27.5.1 An Example of Exponential Distribution……Page 269
27.5.2 An Example of Maximum of an Exponential Distribution……Page 271
27.6 Weibull Distribution……Page 272
27.6.1 An Example of a Weibull Distribution……Page 273
27.7 Log-Normal Distribution……Page 274
27.8 Truncated Normal Distribution……Page 277
28.1 Introduction……Page 278
28.2.1 A Worked Example of Value at Risk……Page 279
28.3 Calculating Value at Risk……Page 281
29.2 The Application of Sensitivity Analysis to Operational Risk……Page 284
30.2 Use of External Loss Data……Page 288
30.4 Consideration of Likelihood……Page 289
30.5 Anonimised Loss Data……Page 290
31.2 Neural Algorithms……Page 292
Appendix Mathematical Symbols and Notation……Page 296
Index……Page 302


Reviews
There are no reviews yet.