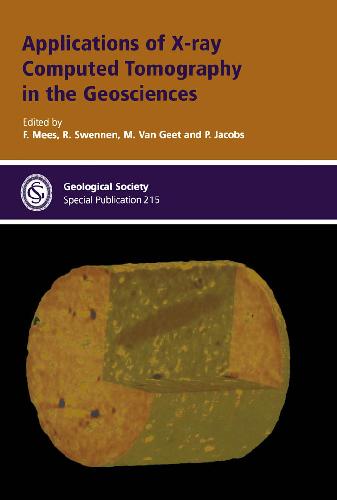
Geological Society Publications1862391394, 9781862391390
Also available:
Mapping Hazardous Terrain using Remote Sensing – Special Publication no 283 – ISBN 1862392293
Table of contents :
Contents……Page 6
Applications of X-ray computed tomography in the geosciences……Page 8
Table 1. General classification of X-ray computed tomography……Page 14
Fig. 1. Isosurface image of garnet (rendered violet) and staurolite (rendered yellow-brown) ………Page 16
Fig. 3. Three-dimensional reconstruction from X-ray CT data of a 15mm cube ………Page 17
Fig. 5. (a) Three-dimensional reconstruction from X-ray CT data of a 1 cm ………Page 18
Fig. 6. Three-dimensional reconstruction from X-ray CT data of porosity dominated by ………Page 19
Fig. 7. (a) Perspective view of X-ray CT images of lodranite meteorite GRA95209 ………Page 20
Fig. 9. Three-dimensional representation of shapes, sizes and positions of metal-troilite particles……Page 21
Fig. 11. (a) Three-dimensional volumetric reconstruction from X-ray CT data of the skull ………Page 22
Fig. 12. (a) Co-evolution of the mammalian mandible and middle ear (in right ………Page 23
Fig. 14. Three-dimensional volumetric rendering from X-ray CT data of the embryonic ………Page 24
Fig. 15. Two computer-generated models of the face of the Archaeoraptor slab ………Page 25
Fig. 18. High-resolution X-ray CT image of the coral Diploria strigosa (edge ………Page 26
Fig. 19. X-ray CT images of trabecular bone of the femoral head ………Page 27
Computed tomography in petroleum engineering research……Page 30
Table 1. CT numbers for common materials……Page 32
Fig. 2. Example of an X-artefact in scanning a homogeneous diatomite core. ………Page 33
Fig. 3. Scans of an imbibition cell that allows imaging of the ………Page 34
Fig. 4. Scans of a carbonate core at 1 cm spacing. Dark ………Page 37
Fig. 5. CT-derived water saturation (S[sub(w)]) images of spontaneous imbibition in diatonaite, ………Page 38
Fig. 6. 3D reconstruction of water saturation in a sandpack undergoing hot-water ………Page 39
Study of the microgeometry of porous materials using synchrotron computed microtomography……Page 46
Fig. 1. X-ray brilliance produced at the Brookhaven National Synchrotron Light Source ………Page 47
Fig. 2. Schematic diagram of the major components in the SCMT apparatus ………Page 48
Fig. 3. A SCMT volume of sandy sediments from the New York/New ………Page 49
Fig. 4. Distribution of elements found in a single grain of sediment ………Page 50
Table 1. Average porosities ε and correlation lengths L[sub(x)], L[sub(y)] and L[sub(z)] ………Page 51
Fig. 8. SCMT sections taken through samples of Darley Dale sandstone in ………Page 52
Fig. 9. Sections through Berea sandstone in its natural state (top) and ………Page 54
Fig. 11. CT image obtained at the APS showing the Wood’s metal ………Page 55
Porosity measurements of sedimentary rocks by means of microfocus X-ray computed tomography (μCT)……Page 58
Fig. 1. Plots of the total linear attenuation coefficient of calcite and ………Page 59
Fig. 2. Macroscopic view of a turbiditic carbonate sample used to compare ………Page 60
Fig. 3. Evaluation of porosity measurements by μCT and classical reflected light ………Page 61
Fig. 5. 3D visualization of the distribution of macroporosity for a turbiditic ………Page 62
Fig. 6. 3D visualization of heterogeneous Westphalian sandstone samples (8 mm in ………Page 63
Fig. 8. Results of mean porosity measurements of sequential slices by μCT ………Page 64
Table 1. Comparison of the results of different porosity measurements (in %) ………Page 65
Quantitative characterizations of fracture apertures using microfocus computed tomography……Page 68
Fig. 2. Convolution of a rectangular profile (fracture) with a PSF, resulting ………Page 69
Fig. 3. Fit of Gaussian and sine function through the fracture attenuation ………Page 70
Fig. 5. Comparison between the performance of PH and MA calculated from ………Page 71
Fig. 6. Coefficient of variation versus fracture aperture for peak height and ………Page 72
Fig. 8. Segment of the fractured sample as determined using microfocus X-ray ………Page 73
Fig. 9. Apertures determined by optical microscopy compared to those determined by ………Page 74
Three-dimensional visualization of fractures in rock test samples, simulating deep level mining excavations, using X-ray computed tomography……Page 76
Fig. 1. (a) Schematic plan view of a South African longwall gold mining ………Page 77
Fig. 2. Cubic sample with mine layout tested in a poly-axial cell ………Page 79
Fig. 4. Fractures observed within a tested Elsburg quartzite sample having a ………Page 80
Fig. 6. CT scans of rock sample showing how the fracture traces ………Page 82
Fig. 9. Three-dimensional reconstruction of the fracture pattern in a Marble Bar ………Page 83
Fig 10. Combination of automatic and manual delineation methods for reconstructing three-dimensional ………Page 84
Fig 11. Example of numerical prediction of the fracture pattern in the ………Page 85
Geostatistics and the representative elementary volume of gamma ray tomography attenuation in rock cores……Page 88
Fig. 1. Orientation of the cores…….Page 91
Table 1. Attenuation statistics of samples……Page 92
Table 2. Component content by percent volume in samples……Page 93
Fig. 4. Computer tomography images and semivariograms of (a) core C1AV and (b) core C2AV…….Page 94
Fig. 5. Semivariograms of computer tomography images for core C2AV with different ………Page 97
Fig. 6. Voxel volume versus range for core C2AV…….Page 99
Table 4. Anisotropy of samples……Page 95
Table 5. Parameters of standardized semivariograms for core C2AV using different aggregations ………Page 98
Porosity and fluid flow characterization of granite by capillary wetting using X-ray computed tomography……Page 102
Fig. 1. Radiological density of minerals occurring in granite, inferred using Eq. 2 ………Page 103
Fig. 3. 3D images of the mineral content. The three sets of ………Page 104
Fig. 4. Radiological density variation induced by different fluids saturating the porosity. ………Page 105
Fig. 5. Radiological density profiles along the core sample. Profiles are built ………Page 107
Fig. 7. (a) Mineral network in section 1 with two K-feldspar phenocrystals, and ………Page 108
Table 1. Capillary parameters inferred from radiological measurements for the different studied volumes……Page 109
Fig. 9. Capillary curves for section 1 and mineral zones D1 to ………Page 110
Fig. 10. Fluid location after 142 and 172 minutes, illustrated by 3D ………Page 111
Direct imaging of fluid flow in fault-related rocks by X-ray CT……Page 114
Fig. 1. Experimental arrangement of the medical X-ray CT scanner W2000…….Page 115
Fig. 2. (a) Schematic diagram of the permeameter cell, (b) Photo image of ………Page 116
Fig. 3. Calibration of CT numbers under different conditions: black symbols – 120kV, ………Page 117
Fig. 4. Photo images of the examined fault-related rocks, (a) IPF-F; (b) CF-P; (c) CF-V…….Page 118
Table 2. Intrinsic permeabilities and compensated permeabilities for the used KI solution……Page 119
Fig. 6. Three-dimensional flow image of sample IPF-P, 150 minutes after initiation ………Page 120
Fig. 7. (a) Converted 8-bit CT image of sample CF-P at the initial ………Page 121
Rock drying tests monitored by X-ray computed tomography – the effect of saturation methods on drying behaviour……Page 124
Fig. 2. Capillary absorption: by-pass of the macropores and trapping of air…….Page 125
Fig. 3. Standard drying kinetic of a porous medium. dW=weight variation; ………Page 126
Fig. 4. CT images of the Fontainebleau sandstone sample Ftx2a2. 1 to 36: ………Page 127
Fig. 5. CT aquisitions plotted on drying curves obtained after total saturation ………Page 128
Fig. 6. RD profile of the dry matrix (RD matrix) and ARD ………Page 129
Fig. 7. (a) Profiles of the mean saturation for each cross-section at the ………Page 130
Fig. 8. (a) Profiles of the mean saturations for each cross-section at the ………Page 131
Characterization by X-ray computed tomography of water absorption in a limestone used as building stone in the Oviedo Cathedral (Spain)……Page 134
Fig. 2. Mercury porosimetry curves showing differences in pore radius between the ………Page 135
Fig. 5. CT image of the vertical central plane of the sample ………Page 136
Fig. 6. Evolution over time during the free absorption test of the ………Page 137
Fig. 8. Scanning electron microscopy images of two adjacent areas (Bl and ………Page 138
Table 1. Evolution of CT numbers (Hounsfield Units) of some ROI’s during the absorption test……Page 139
Fig. 10. Evolution of the mean CT number (in Hounsfield Units) for ………Page 140
Estimation of porosity and hydraulic conductivity from X-ray CT-measured solute breakthrough……Page 142
Fig. 1. Schematic of soil column assembly used to saturate and conduct ………Page 144
Fig. 3. Relative solute concentration (C*) versus cumulative outflow measured using CT ………Page 148
Table 2. Average porosity for undisturbed soil cores determined using CT-measured solute breakthrough methods……Page 149
Fig. 5. Frequency distributions of CT-measured solute velocity for Core #3: (a) velocity ………Page 150
Table 4. Average hydraulic conductivity for undisturbed soil cores determined using CT-measured solute breakthrough methods……Page 152
Table 5. Calculated dispersivities and retardation coefficients as a function of scan ………Page 153
Fig. 8. Relative concentration (C*) of chlorophenol versus cumulative outflow for both ………Page 154
Table 1. Physical properties of undisturbed soil cores determined on a bulk core basis……Page 143
Assessment of solid structure using X-ray computed tomography……Page 158
Fig. 1. Scheme of the computationally inscribed largest possible reference cube in ………Page 162
Fig. 2. Scheme of the measurement of Hounsfield Unit values around an ………Page 163
Table 4. Unsaturated hydraulic conductivity (K) of the soils and horizons investigated, ………Page 165
Fig. 6. Pseudo-3D visualization of macropores (left), dry bulk density and standard ………Page 166
Fig. 7. Pseudo-SD visualization of macropores (left), dry bulk density and standard ………Page 167
Fig. 9. Dry bulk density and standard deviation distribution for horizontal slices ………Page 168
Table 5. Gravimetric water content near earthworm burrow, site F……Page 169
Table 1. Sampling sites……Page 160
Table 2. Properties of soils and horizons investigated……Page 161
Table 3. Circle areas, diameters, mean Hounsfield Unit values and mean dry ………Page 164
3D soil image characterization applied to hydraulic properties computation……Page 174
Fig. 3. Seed map: maximum balls (or seeds) have been set in ………Page 176
Fig. 5. Construction of a link c[sub(1)]c[sub(2)] in the network from two ………Page 177
Fig. 6. (a) 2D original image – black represents solid space and white ………Page 179
Fig. 7. (a) 3D soil image – grey represents the void space; (b) ………Page 180
Evaluation of local porosity changes in limestone samples under triaxial stress field by using X-ray computed tomography……Page 184
Fig. 1. Schematic representation of the X-ray-transparent triaxial cell…….Page 186
Fig. 3. Normalized porosity change as a function of hydrostatic pressure in ………Page 188
Fig. 5. Stress–strain diagram and X-ray radiographs of ductile failure of limestone, ………Page 189
Fig. 6. Porosity evolution as a function of differential stress and images ………Page 191
Fig. 8. Porosity evolution as a function of differential stress in the ………Page 192
Fig. 9. Porosity change as a function of differential stress and CT ………Page 193
Fig. 11. Permeability change during ductile failure…….Page 194
Monitoring void ratio redistribution during continuous undrained triaxial compression by X-ray computed tomography……Page 198
Fig. 1. Triaxial apparatus on CT scanner bed…….Page 200
Fig. 4. Relationship between attenuation and sample diameter…….Page 201
Fig. 5. Variation in slice void ratio with axial strain level…….Page 202
Fig. 6. Void ratio redistribution along the stress path…….Page 203
Fig. 1. Indicative two-dimensional particulate soil model…….Page 206
Fig. 2. Modified Rowe cell (not to scale)…….Page 207
Fig. 4. Cross-sectional image of approximately the same section (a) before and ………Page 209
Fig. 5. Longitudinal sectional images reconstructed from axial scans…….Page 210
Industrial X-ray computed tomography studies of lake sediment drill cores……Page 212
Fig. 1. Examples of the use of grey-scale values for qualitative investigations ………Page 213
Fig. 2. Three CT images, up to 5 cm apart, showing angular ………Page 214
Fig. 3. Photograph (left), X-ray radiograph (centre) and representative CT images (right) ………Page 215
Fig. 4. 3D visualization of a 5 cm high section of the ………Page 216
Fig. 5. Density profile of an approximately 9 cm long core section ………Page 218
Analysis of analogue models by helical X-ray computed tomography……Page 220
Fig. 1. Experimental modelling of mountain-building processes by Cadell (1890), who shortened ………Page 221
Fig. 2. (a) Helical X-ray CT scanner and experimental apparatus. During rotation of ………Page 222
Fig. 3. Initial experimental set-up for testing the influence of basal rheological ………Page 224
Fig. 4. Comparison of structural evolution between brittle and brittle-viscous domains for ………Page 225
Fig. 6. Two three-dimensional views of an analogue model at 6 cm shortening. ………Page 226
Fig. 8. Vertical sections through the brittle-viscous multilayer model at 2 cm extension, ………Page 227
Fig. 10. Horizontal section through a 3D view of the analogue model ………Page 228
Table 1. Material parameters and distributors of analogue materials……Page 223
Preliminary microfocus X-ray computed tomography survey of echinoid fossil microstructure……Page 232
Fig. 1. Geometry of the Aristotle’s lantern and portions of the test ………Page 233
Fig. 2. Slices of two different fossil spines (a and b); the ………Page 235
Fig. 3. Three slices through a cidaroid spine showing a complex ‘tidemark’ ………Page 236
Fig. 4. Two Slices through a fossil pyramid, separated by 0.95 mm ………Page 237
Fig. 6. Five slices through the plate fragment. The horizontal field of ………Page 238
Fig. 7. Three-dimensional rendering of the volume of the plate shown in Figure 6…….Page 239
E……Page 244
L……Page 245
O……Page 246
P……Page 247
S……Page 248
X……Page 249



Reviews
There are no reviews yet.