Darryl Gove0138134553, 9780138134556
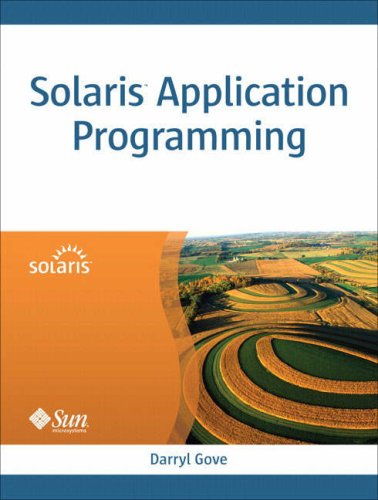
Whether you’re new to performance analysis and optimization or an experienced developer searching for the most efficient ways to solve performance issues, this practical guide gives you the background information, tips, and techniques for developing, optimizing, and debugging applications on Solaris.
The text begins with a detailed overview of the components that affect system performance. This is followed by explanations of the many developer tools included with Solaris OS and the Sun Studio compiler, and then it takes you beyond the basics with practical, real-world examples. In addition, you will learn how to use the rich set of developer tools to identify performance problems, accurately interpret output from the tools, and choose the smartest, most efficient approach to correcting specific problems and achieving maximum system performance.
Coverage includes
A discussion of the chip multithreading (CMT) processors from Sun and how they change the way that developers need to think about performance A detailed introduction to the performance analysis and optimization tools included with the Solaris OS and Sun Studio compiler Practical examples for using the developer tools to their fullest, including informational tools, compilers, floating point optimizations, libraries and linking, performance profilers, and debuggers Guidelines for interpreting tool analysis output Optimization, including hardware performance counter metrics and source code optimizations Techniques for improving application performance using multiple processes, or multiple threads An overview of hardware and software components that affect system performance, including coverage of SPARC and x64 processors
Table of contents :
Solaris application programming……Page 1
Contents……Page 6
Preface……Page 20
PART I: Overview of the Processor……Page 24
1.2 The Components of a Processor……Page 26
1.3 Clock Speed……Page 27
1.4 Out-of-Order Processors……Page 28
1.5 Chip Multithreading……Page 29
1.6 Execution Pipes……Page 30
1.7 Caches……Page 34
1.8 Interacting with the System……Page 37
1.9 Virtual Memory……Page 39
1.11 Instruction Set Architecture……Page 41
2.2 The UltraSPARC Family……Page 44
2.3 The SPARC Instruction Set……Page 46
2.5 The UltraSPARC III Family of Processors……Page 53
2.7 UltraSPARC T2……Page 60
2.8 SPARC64 VI……Page 61
3.2 The x64 Family of Processors……Page 62
3.3 The x86 Processor: CISC and RISC……Page 63
3.4 Byte Ordering……Page 64
3.5 Instruction Template……Page 65
3.6 Registers……Page 66
3.8 Memory Ordering……Page 69
PART II: Developer Tools……Page 70
4.2 Tools That Report System Configuration……Page 72
4.3 Tools That Report Current System Status……Page 78
4.4 Process- and Processor-Specific Tools……Page 95
4.5 Information about Applications……Page 107
5.2 Three Sets of Compiler Options……Page 116
5.3 Using -xtarget=generic on x86……Page 118
5.4 Optimization……Page 119
5.5 Generating Debug Information……Page 125
5.6 Selecting the Target Machine Type for an Application……Page 126
5.7 Code Layout Optimizations……Page 130
5.8 General Compiler Optimizations……Page 139
5.9 Pointer Aliasing in C and C++……Page 146
5.10 Other C- and C++-Specific Compiler Optimizations……Page 156
5.11 Fortran-Specific Compiler Optimizations……Page 158
5.12 Compiler Pragmas……Page 159
5.13 Using Pragmas in C for Finer Aliasing Control……Page 165
5.14 Compatibility with GCC……Page 170
6.2 Floating-Point Optimization Flags……Page 172
6.3 Floating-Point Multiply Accumulate Instructions……Page 196
6.4 Integer Math……Page 197
6.5 Floating-Point Parameter Passing with SPARC V8 Code……Page 201
7.2 Linking……Page 204
7.3 Libraries of Interest……Page 216
7.4 Library Calls……Page 222
8.2 The Sun Studio Performance Analyzer……Page 230
8.3 Collecting Profiles……Page 231
8.5 Viewing Profiles Using the GUI……Page 233
8.6 Caller–Callee Information……Page 235
8.7 Using the Command-Line Tool for Performance Analysis……Page 237
8.8 Interpreting Profiles……Page 238
8.9 Intepreting Profiles from UltraSPARC III/IV Processors……Page 240
8.10 Profiling Using Performance Counters……Page 241
8.11 Interpreting Call Stacks……Page 242
8.12 Generating Mapfiles……Page 245
8.13 Generating Reports on Performance Using spot……Page 246
8.14 Profiling Memory Access Patterns……Page 249
8.15 er_kernel……Page 256
8.16 Tail-Call Optimization and Debug……Page 258
8.17 Gathering Profile Information Using gprof……Page 260
8.18 Using tcov to Get Code Coverage Information……Page 262
8.19 Using dtrace to Gather Profile and Coverage Information……Page 264
8.20 Compiler Commentary……Page 267
9.1 Introduction……Page 270
9.2 Compile-Time Checking……Page 271
9.3 Runtime Checking……Page 279
9.4 Debugging Using dbx……Page 285
9.5 Locating Optimization Bugs Using ATS……Page 294
9.6 Debugging Using mdb……Page 297
PART III: Optimization……Page 300
10.2 Reading the Performance Counters……Page 302
10.3 UltraSPARC III and UltraSPARC IV Performance Counters……Page 304
10.4 Performance Counters on the UltraSPARC IV and UltraSPARC IV+……Page 325
10.5 Performance Counters on the UltraSPARC T1……Page 327
10.6 UltraSPARC T2 Performance Counters……Page 331
10.7 SPARC64 VI Performance Counters……Page 332
10.8 Opteron Performance Counters……Page 333
11.2 Traditional Optimizations……Page 342
11.3 Data Locality, Bandwidth, and Latency……Page 349
11.4 Data Structures……Page 362
11.5 Thrashing……Page 372
11.6 Reads after Writes……Page 375
11.7 Store Queue……Page 377
11.8 If Statements……Page 380
11.9 File-Handling in 32-bit Applications……Page 387
PART IV: Threading and Throughput……Page 392
12.2 Processes, Threads, Processors, Cores, and CMT……Page 394
12.3 Virtualization……Page 397
12.4 Horizontal and Vertical Scaling……Page 398
12.5 Parallelization……Page 399
12.6 Scaling Using Multiple Processes……Page 401
12.7 Multithreaded Applications……Page 408
12.8 Parallelizing Applications Using OpenMP……Page 425
12.9 Using OpenMP Directives to Parallelize Loops……Page 426
12.10 Using the OpenMP API……Page 429
12.11 Parallel Sections……Page 430
12.12 Automatic Parallelization of Applications……Page 431
12.13 Profiling Multithreaded Applications……Page 433
12.14 Detecting Data Races in Multithreaded Applications……Page 435
12.15 Debugging Multithreaded Code……Page 436
12.16 Parallelizing a Serial Application……Page 440
PART V: Concluding Remarks……Page 458
13.2 Algorithms and Complexity……Page 460
13.3 Tuning Serial Code……Page 465
13.4 Exploring Parallelism……Page 467
13.5 Optimizing for CMT Processors……Page 469
A……Page 470
C……Page 471
D……Page 473
F……Page 475
H……Page 476
I……Page 477
L……Page 478
M……Page 479
O……Page 481
P……Page 482
R……Page 484
S……Page 485
T……Page 488
W……Page 489
X……Page 490
Z……Page 491

Reviews
There are no reviews yet.